STYLIE: Difference between revisions
| Line 37: | Line 37: | ||
* Documentation: [https://github.com/Nilly92/IEF_Visualization/ https://github.com/Nilly92/IEF_Visualization] (will be made publicly available once the implementation is mature) | * Documentation: [https://github.com/Nilly92/IEF_Visualization/ https://github.com/Nilly92/IEF_Visualization] (will be made publicly available once the implementation is mature) | ||
* Source code: [https://github.com/Nilly92/IEF_Visualization/ https://github.com/Nilly92/IEF_Visualization] (will be made publicly available once the implementation is mature) | * Source code: [https://github.com/Nilly92/IEF_Visualization/ https://github.com/Nilly92/IEF_Visualization] (will be made publicly available once the implementation is mature) | ||
The following sample application of STYL~IE shows the results of the RECC v2.5 model for global buildings [https://www.industrialecology.uni-freiburg.de/odym-recc]. | |||
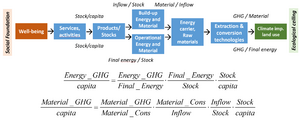
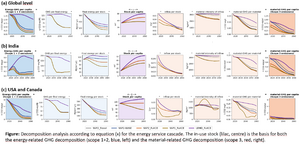
The upper figure on the right shows the different steps in the energy service cascade that are included in the STYL~IE accounting equations below, and the lower figure on the right shows sample results for the building stock in different regions. | |||
[[File:Stylie1.png|thumb|Energy service casade with central stock and flow variables and STYL~IE accounting equations for energy-related GHG (scope 1+2) and material-related GHG (scope 3).]] | |||
Most scenarios show substantial decoupling of per capita GHG for both scope 1+2 (energy supply) and scope 3 (material supply) for the building stock (STYL~IE figure on the right side). Despite growing stock levels, decoupling of energy-related GHG by reducing the energy consumption per built-up stock by half to two thirds and the GHG intensity of energy supply down to a small fraction of current values (STYL~IE figure with results, blue plots, left). Material-related GHG decline as well, driven by less inflow per stock (as stocks grow and construction declines) and a decline of the GHG intensity per ton of material supply by about two thirds (combined effect of more recycling/CE and less carbon-intensive primary production) (STYL~IE figure with results, red plots, right). Due to the high construction demand in some world regions (India chosen as representative region here), and the slow rise of low-carbon materials, the material-related scope 3 emissions are of similar size, and at times even larger, than the scope 1+2 emissions. This finding highlights the importance of including these embodied or ‘grey’ emissions in a consistent model approach of the building sector and require a policy debate on their mitigation | |||
[[File:Stylie2.png|thumb|STYL~IE accounting equations for energy-related GHG (scope 1+2) and material-related GHG (scope 3) for the building stock (residential and non-residential) in selected regions. Source: RECC v2.5 model results.]] | |||
== Circular Economy Features == | == Circular Economy Features == | ||
Revision as of 21:24, 23 February 2024
General Scope and Connection with Climate Mitigation
Introduction
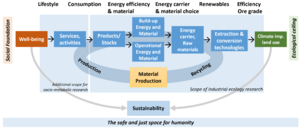
In industrial ecology and socio-metabolic research, we operationalise the doughnut economy framework by adding the different steps of the so-called energy and material service cascade, which is a cascade of system couplings, including the following links: services (like transport thermal comfort) to wellbeing, functions (car driving, building heated) to services, products (cars, houses) to functions, energy and material to build products, energy and material to operate products, energy carriers and raw materials, resource extraction and energy conversion technologies, and the impact of all these activities on the environment (see Figure below and check here for details). Central in the energy service cascade is the so-called stock-flow service nexus, comprising the blue boxes ‘services/activities’, ‘functions’, ‘products/stocks’, and build-up and operational energy and material flows. This nexus is an important system linkage in society’s metabolism, as it links energy and material flows to service provision for human wellbeing.
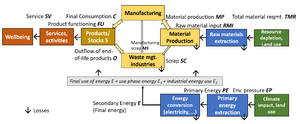
STYLIE (from the Stylistic industrial ecology (IE) model) is a simple accounting tool for the energy and material service cascade to capture the major service flows, product stocks, and energy and material flows in a circular economy. It has a comprehensive scope, as it links service provision (a major constituent of human well-being) with environmental pressures (such as resource extraction and climate impact). Based on the energy and material service cascade concept, its system definition is shown below.
The main references for this system concept and the accounting model STYLIE are:
- For the stock-flow-service nexus in the energy service cascade (system definition), see Bergsdal et al. (2007), Kalt et al. (2019), and Haberl et al. (2017).
- For existing examples of the accounting equation, see the description of the IPAT equations as well as the IE literature: Carmona et al. (2022), Tanikawa et al. (2021).
Model Scope
STYLIE can be applied at any geographical, service sector, and material scale. As an accounting model, it does not generate new results but uses results from existing scenarios calculated by other models to develop a set of indicators and show where in the energy service cascade the decoupling happens.
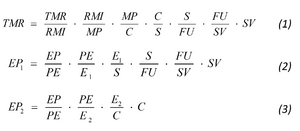
The accounting equations of STYLIE (see figure on the right) follow the scheme of the widely known IPAT accounting equation, as they expand the total pressure indicator into the different system variables, rearranging them to a decoupling factor for each stage in the energy service cascade.
Each of the factors in the model equations has a distinct meaning. For example, the variable denotes the material consumption needed to expand and maintain a given in-use stock . The indicator raw material input per material production describes the dependency of material production on natural resources, whereas its complement, the recycled content is a salient CE indicator.
The quantity denotes the in-use stock needed to deliver a certain function, such as heating of buildings and vehicle kilometers driven. It illustrates the intensity of using products, vehicles, and buildings.
To quantify the impact of CE strategies from a systems perspective, not only the implications for material use need to be looked at, but also the energy implications, as energy supply is a major driver of climate change and land use. Here, we use the energy accounting equations for energy use for operating products, vehicles, and buildings (use phase energy ) and the industrial energy use . Salient indicators here are the GHG intensity of energy supply , the energy intensity of the in-use stock , and the energy intensity of material supply .
Next to the indicators listed in the equations, several other salient CE performance and impact indicators can be quantified if the supplying models provide the corresponding information to STYLIE, including.
- Material productivity of service provision as
- Stock retention time as (the average time it takes to completely replace the existing in-use stock with the current consumption level)
- Material stock productivity as
- Material productivity of the economy as
Model Development and sample results
- Status: Under implementation for analyzing CIRCOMOD results with simple but insightful graphical visualizations
- Environment: Javascript
- Documentation: https://github.com/Nilly92/IEF_Visualization (will be made publicly available once the implementation is mature)
- Source code: https://github.com/Nilly92/IEF_Visualization (will be made publicly available once the implementation is mature)
The following sample application of STYL~IE shows the results of the RECC v2.5 model for global buildings [1].
The upper figure on the right shows the different steps in the energy service cascade that are included in the STYL~IE accounting equations below, and the lower figure on the right shows sample results for the building stock in different regions.
Most scenarios show substantial decoupling of per capita GHG for both scope 1+2 (energy supply) and scope 3 (material supply) for the building stock (STYL~IE figure on the right side). Despite growing stock levels, decoupling of energy-related GHG by reducing the energy consumption per built-up stock by half to two thirds and the GHG intensity of energy supply down to a small fraction of current values (STYL~IE figure with results, blue plots, left). Material-related GHG decline as well, driven by less inflow per stock (as stocks grow and construction declines) and a decline of the GHG intensity per ton of material supply by about two thirds (combined effect of more recycling/CE and less carbon-intensive primary production) (STYL~IE figure with results, red plots, right). Due to the high construction demand in some world regions (India chosen as representative region here), and the slow rise of low-carbon materials, the material-related scope 3 emissions are of similar size, and at times even larger, than the scope 1+2 emissions. This finding highlights the importance of including these embodied or ‘grey’ emissions in a consistent model approach of the building sector and require a policy debate on their mitigation
Circular Economy Features
The main relevance of STYLIE for assessing circular economy strategies lies in its explicit inclusion of the stock-flow-service nexus (services require in-use stocks, which in turn require energy and material input for their operation, maintenance, and expansion), as well as its inclusion of primary (from natural resources) and secondary (via recycling) material production. With its broad system coverage (from environmental pressure to service provision), all CE strategies that affect one or more steps in the energy service cascade shown above are included in the assessment.
This includes, in particular, the following strategies:
- Refuse (R0): Scenarios with reduced stock S or consumption C.
- R2e Lifetime extension (Reduce (R2)): shown by a decrease in C/S.
- R2f Lightweighting (Reduce (R2)): shown by a decrease in C.
- R2h+i Less fabrication scrap (Reduce (R2)): shown by a decrease of MP/C.
- R3-7 Reuse (Re-use (R3), Repair (R4), Refurbish (R5), Repurpose (R7)): shown by a decrease in RMI.
- Recycle (R8): shown by a decrease in RMI.
The additional energy and environmental pressure (including GHG) accounting equations allow us to assess the environmental implications of different CE strategies, provided that the underlying scenario model reports pressures such as GHG emissions and beyond. The model indicators show the net effect of different CE and other sustainable development strategies (such as low-carbon energy or sufficiency) so that the overall synergies and trade-offs across a wide spectrum of transformation strategies can be shown.
Insights for Analytical Framework
STYLIE allows for analyzing the large trends in service provision, material cycles, and energy use. It shows where decoupling happens in the energy service cascade and where it does not, pointing to contradictory trends or overlooked mitigation options.
Due to its flexibility regarding variables included and model results analysed, it can illustrate and consistently check a wide spectrum of CE models.
At the same time, the explorative nature of the tools allows for demonstrating the overall effect of different CE strategies under different scenario assumptions as well as the communication of key CE dynamics to a broader audience.
Refinement, Integration, Future Development
Refinement process
Since not all models can calculate all variables in the system definition of STYLIE, the accounting equations (see above) will be simplified (aggregated) or modified so that the system definition and salient stocks and flows of the different models can be depicted.
Integration
Building on model results supplied to the CIRCOMOD data hub, STYLIE-based visualisations will be implemented on the project's homepage.
Future features of the model
Different visualisations of STYLIE results and new STYLIE indicators will be developed to address the various research questions on the performance and impact of CE strategies at different locations in the system.

